
As the S&P 500 Index is sitting below its 50-day moving average, the Nasdaq Composite Index has already locked in the fastest correction in its history. In early September, “the Naz” only took four trading sessions to shave 10% off its all-time high. Add that to the n=1 events of 2020 list (1). In fact, if we compiled a list of n=1 events that have occurred in 2020, I would imagine that list would be an n=1 event in and of itself (don’t steal my idea either, I’m saving that for the end of the year!).
Before we look at the two charts below, let’s set the table with a quote from Peter L. Bernstein’s classic book, Against the Gods: The Remarkable Story of Risk.
“One winter night during one of the many German air raids on Moscow during WWII, a distinguished Soviet professor of statistics showed up in his local air-raid shelter. He had never appeared there before. ‘There are seven million people in Moscow,’ he used to say. ‘Why should I expect them to hit me?’ His friends were astonished to see him and asked what had happened to change his mind. ‘Look,’ he explained, ‘there are seven million people in Moscow and one elephant. Last night, they got the elephant.'”
When we speak on the probability of rare events taking place, even the most informed statisticians are prepared to be humbled by showing up to a bomb shelter where their friends will meet them with great surprise.
The chart below in blue shows the forward 1-month returns of the S&P 500 when the Conference Board US Leading Ten Economic Indicators are positive on a year-over-year basis, with data going back to 12/31/59. What do we see here? A relatively normal distribution of returns. AKA, not a huge likelihood of getting hit by a bomb. 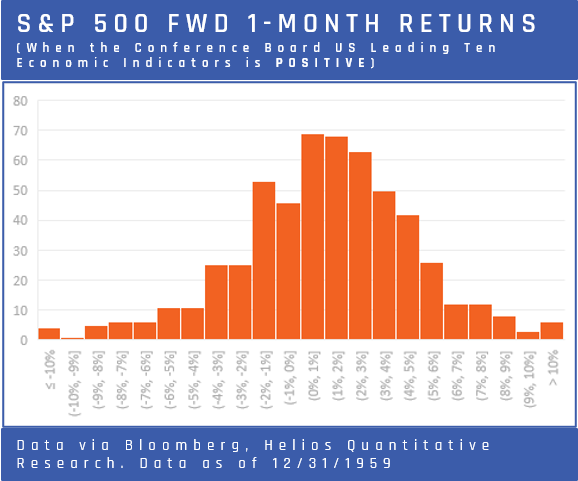 Now let’s take a look at the same data set, but change it from when the Conference Board US Leading Ten Economic Indicators are positive to when they are negative on a year-over-year basis. Before you jump to conclusions, note that there is a much larger sample size for the blue chart than the red one. However, even when we adjust the chart for scaling, we quickly see a distinct difference in shape. AKA, there is a greater likelihood of getting hit by a bomb.
 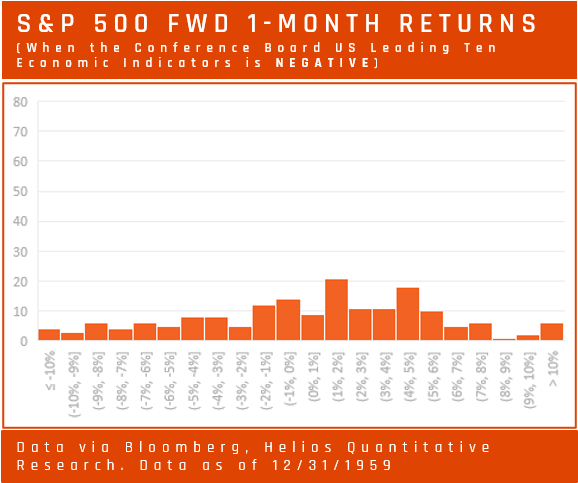 Spoiler alert, right now, the Conference Board US Leading Ten Economic Indicators are negative -4.7% YoY as of 8/31/2020, which means some things and doesn’t mean other things (detailed, I know). When looking at how the aggregate economic indicators are changing, it helps frame expectations for forward returns of the equity markets. By using the story in Bernstein’s book, the metaphor would be that the likelihood of getting hit by a bomb is heightened at this time. However, it does not mean that we will get hit by a bomb such as another bear market correction; it just means that the likelihood of it occurring is higher. It’s not a question of market timing or guaranteeing a drop in markets; it is a call on probability and whether you should insulate your portfolio against a substantial loss given its increased likelihood. If forward returns have a statistical probability of distributing a wider range of potential outcomes (specifically to the left of the curve), then we must consider our client’s risk profile when investing in the coming months. However, we should not only consider their personal tolerance but their sequential risk tolerance as well. Said another way, if market risk is a topic of discussion when you take risk should be as important as how much risk you take. Those with many years ahead of them may see the increased likelihood of greater volatility to be an opportunity. However, those who are much further along in their investment journey may find that the risk of taking a bomb-like hit to their elephant-sized portfolio outweighs the risk of not participating in the potential upside markets may provide. Recently we held a continuing education webinar for Financial Advisors with a small bond shop named PIMCO; the chart below is from that presentation.
 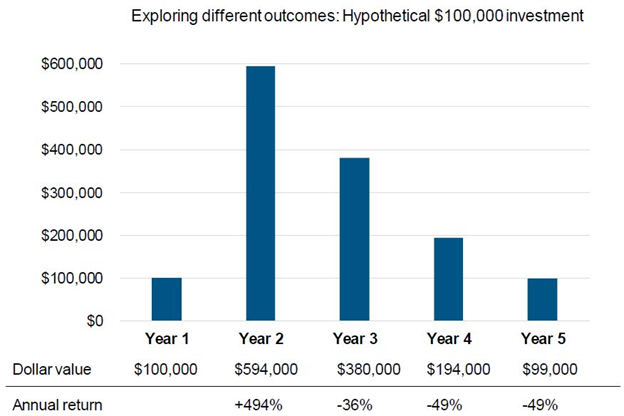 If you’ve ever played cards at a casino, quickly won a big pot, stayed for another couple hours, and then ended up leaving with about the same amount of money that you started with, then you understand sequence risk outlined in the image above. Who cares if you win a big hand if you end up leaving with the same amount you started with? Winning big early is great. Losing later is a disaster. It is the difference between gamblers and investors.