
The inversion of the 2-year Treasury and 10-year Treasury rates have long been a predictor of a coming recession – but why? A yield curve inversion is an important piece of data that points toward a potential future of the economy where monetary policy, inflation, and risk premia combine. It is a warped set of expectations related to current economic risk vs the perceived direction of long-run economic forces. In short, when the 2-10 yield curve inverts, the odds go WAY up that the economy may recede in the coming years. Like we do with everything else here at Helios, let’s do a quick review of the data to understand where we should place our concerns.
The below chart is a list of the first 2-10 yield curve inversion before the next technical recession. 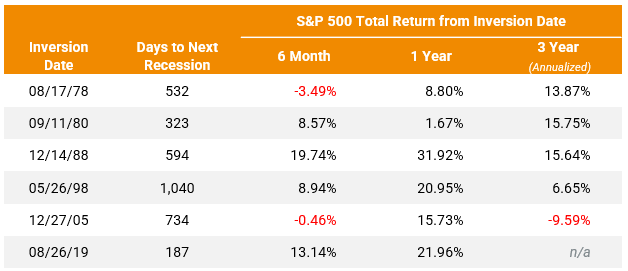 Key takeaways:
1. Why don’t I see anything in 2000 and 2008? You’ll notice the 2-10 yield curve first inverted in 1998 and 2005, respectively. The yield curve inverted again in 2000 and 2007, respectively.
2. Our simple analysis shows that an inversion usually precedes a recession by at least a year… if not much more time. We consider 2019 short time frame to be “influenced” by the COVID-related government shutdown.
3. Historically, inversions do not singularly predict market losses on a 1- or 3-year basis. It’s important to recognize that many additional factors with more “predictive” qualities must be accounted for.
The bottom line: The yield curve is an important metric that helps quantify the future concerns of the economy. However, it is not a data point that historically corresponds to massive short-term volatility. More corroborative data is needed to justify taking meaningful actions to mitigate portfolio risk. For the moment, we believe the preponderance of the economic and market data shows opportunity in equity markets… at least for now.