
In the award-winning movie, The Matrix, there is a famous scene which attempts to explain the concept of deja vu as a glitch, created through flawed coding. The main character, Neo, notices a black cat shake itself, meow, and then walk past him. A split second later, he sees the same black cat shake, meow, and walk past him again. As he naively points out his observation to the group, they recognize the apparent deja vu as a sign that the software they are occupying is being manipulated, and immediately attempt to escape their location before they meet their demise. Most people assume an ETF and the index it is designed to track as synonymous because they cannot tell the difference. For example, when you compare SPY and the S&P 500 index on a chart, they are nearly indistinguishable between each other. Of course, it is a mistake to assume the same performance between a passive investment and the index it is designed to track for one of many simple reasons such as fees. However, there are rare occasions where factors such as extreme volume can cause a “glitch” or slippage between the immediate price of an investment and the net asset value (NAV) of the index holding the same securities. When you compare the charts, they no longer appear to be identical. These incongruent behaviors, among others, are why our industry regularly parrots the phrase, “you cannot invest directly in any index” when it shows the returns associated with an index. Unlike the deja vu experienced by Neo, where an identical cat is seen repeating itself in a loop like fashion, our slippage is akin to seeing one cat’s shadow behaving differently than the cat itself. It is almost as if the shadow is taking steps before the actual cat takes them. In the recent case of bond ETFs and the index they track, we have seen this phenomenon take place. Check out the ETF AGG versus its tracking benchmark, the Bloomberg Barclays US Aggregate Bond Index. Notice anything? The numbers are different. We see dramatic underperformance, in both MTD and YTD figures, unlike 2017 and 2018.  data via Bloomberg Naturally, investors want to know the answers to four questions.
- What causes the dislocation to occur?
- Has it ever happened before?
- Is there a loss of return?
- What are the impacts?
What causes the dislocation to occur?
To explain, we need to understand some basics of ETFs. ETFs trade on an exchange and are bought and sold all day long. Most of the time, the value of the ETF closely matches the sum of the valuation of the underlying holdings. Markets make this relationship efficient by allowing the creation and redemptions of shares for their underlying components. However, in times of market stress where people put a lot of pressure on buying or selling, the relationship between the creation and redemption of shares can widen for short periods. In the stock market, you may barely notice the delay occur, like never noticing the shadow of a cat having a 0.01 millisecond delay. When we look at fixed income, the discrepancy is more apparent as they can have thousands of underlying holdings and can trade faster, thus taking more time to catch up when some of those bond holdings may not have traded yet (or had very wide bid/ask spreads). Therefore, the ETF is trading based upon the perceived value of the underlying holdings, even if they don’t have a recent trade for true price discovery. Are you still following? Great, because we’re about to add another layer of complexity. The index will calculate its values daily, based upon a rules-based approach. However, this may not always represent the liquidation value of the positions when transactions rapidly take place throughout the day. For this reason, you may hear people say things like “ETFs are better pricing indicators than indices,” which is like saying the shadow of a cat is a better indicator of future movements than the actual cat’s movements. The chart below shows us the dislocation between the AGG and its benchmark. Clearly, things became dislocated on March 10th, 11th, 12th, etc. Do you know what else happened in the market on those dates? A historic amount of trading, that’s what.  data via Bloomberg
Has it ever happened before?
Yes. However, not often. The chart below shows a highly volatile period in 2008, where roughly three months of volatile market swings caused dislocation. On October 10th, 2008, the gap between NAV and AGG’s price was separated by over $8/share. Is that a lot, you ask? Yes, it is. Ultimately, the values converged, the prices closely aligned, and the cat and his shadow continued to coexist in peace. 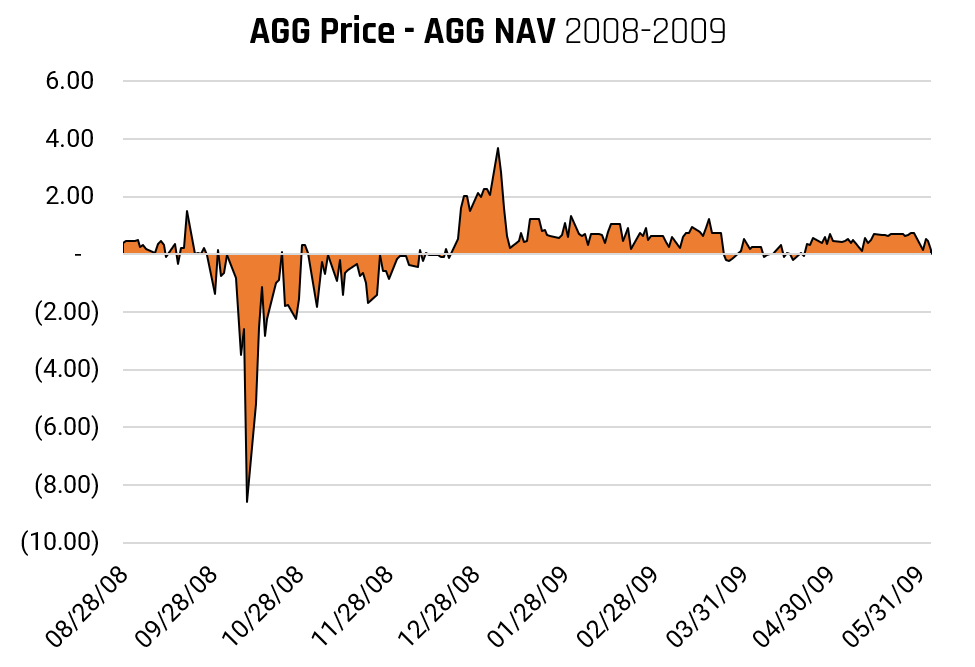 data via Bloomberg
Is there a loss of return?
The answer to this is much more nuanced. However, to make things simple, let’s imagine you already own AGG and are noticing your returns look worse than the index. The chart below shows that you don’t have much to worry about, as over time, the difference in total return converge and any loss relative to the index is compensated by greater performance as the fund “catches up.” 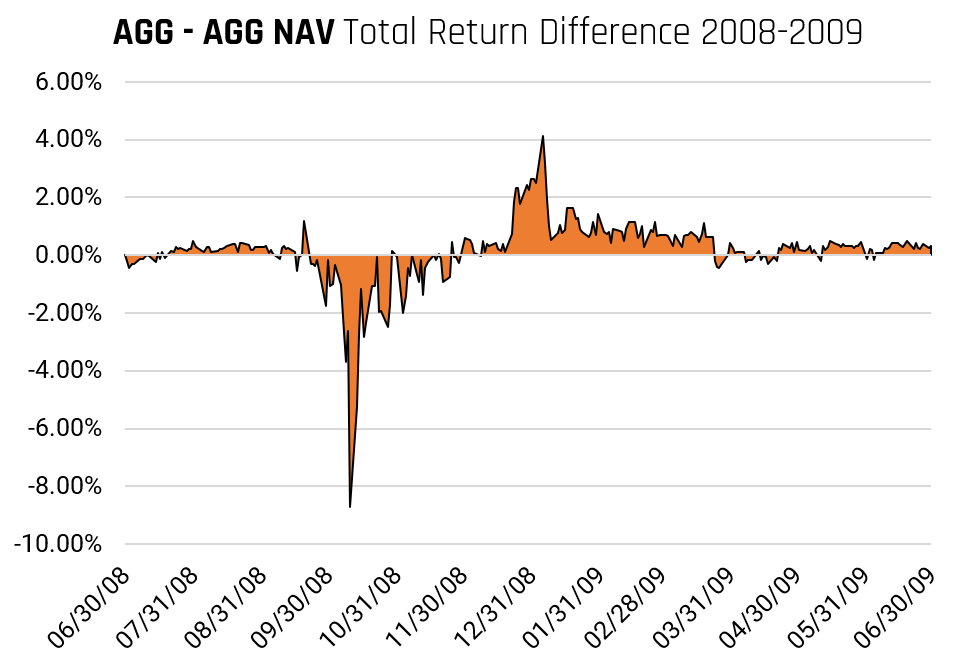 data via Bloomberg
What are the impacts?
The chart below shows that this phenomenon is occurring in many ETFs across various asset classes in the fixed income space. If you are comparing your portfolio of ETFs to an index, or a blend of indices, you will most likely be curious why you are underperforming by such a wide margin. Well, now you know that it is not the ETFs itself underperforming, it’s the NAV of the index being delayed. Over time these numbers will wash out. 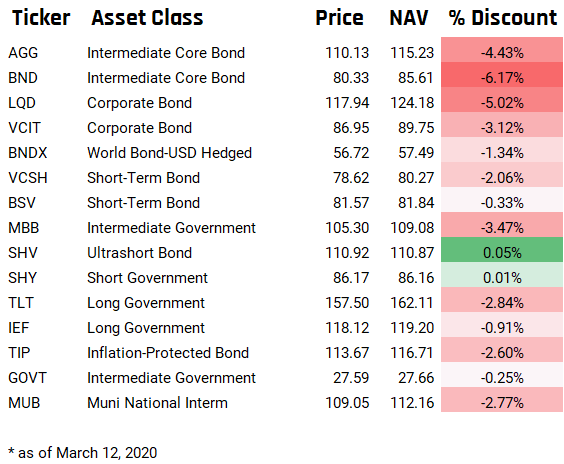 data via Bloomberg
Summary
Bond ETFs can behave differently than their underlying index, which results in varying performance data for short periods and eventually converges back to normal over more extended periods of reduced market stress. We have experienced the fastest bear market in history, and we expect that there will be some “glitches in the matrix” along the way. Luckily for us, we don’t have to attempt an escape to avoid our demise, as simply staying put will take care of that!