
Investors developed a thick layer of skepticism after incurring deep scars from the 2008 financial crisis, and there were many reasons to be bearish during the 2010s. US economic data never reached roaring status and was inclined to receive historical intervention by the Federal Reserve on numerous occasions. Deficits grew under healthcare reform from the left and tax cuts from the right. Earnings growth contracted for five consecutive quarters between 2015 and 2016. Control of the major branches of government was divided for 70% of the decade with a few shutdowns sprinkled between. The trend in unemployment continued to drop one point at a time while inflation and wage increases were muted. Revenues increased at the cost of profits leaving the relative valuation of large companies above (and sometimes well above) their historical averages. Volatility hit its all-time low and basically disappeared for an entire trip around the sun during 2017s “perfect year.” Meanwhile, the entire decade never saw a decline greater than 20% in the S&P 500 after a trading day’s close (although, we did pass it during intraday). 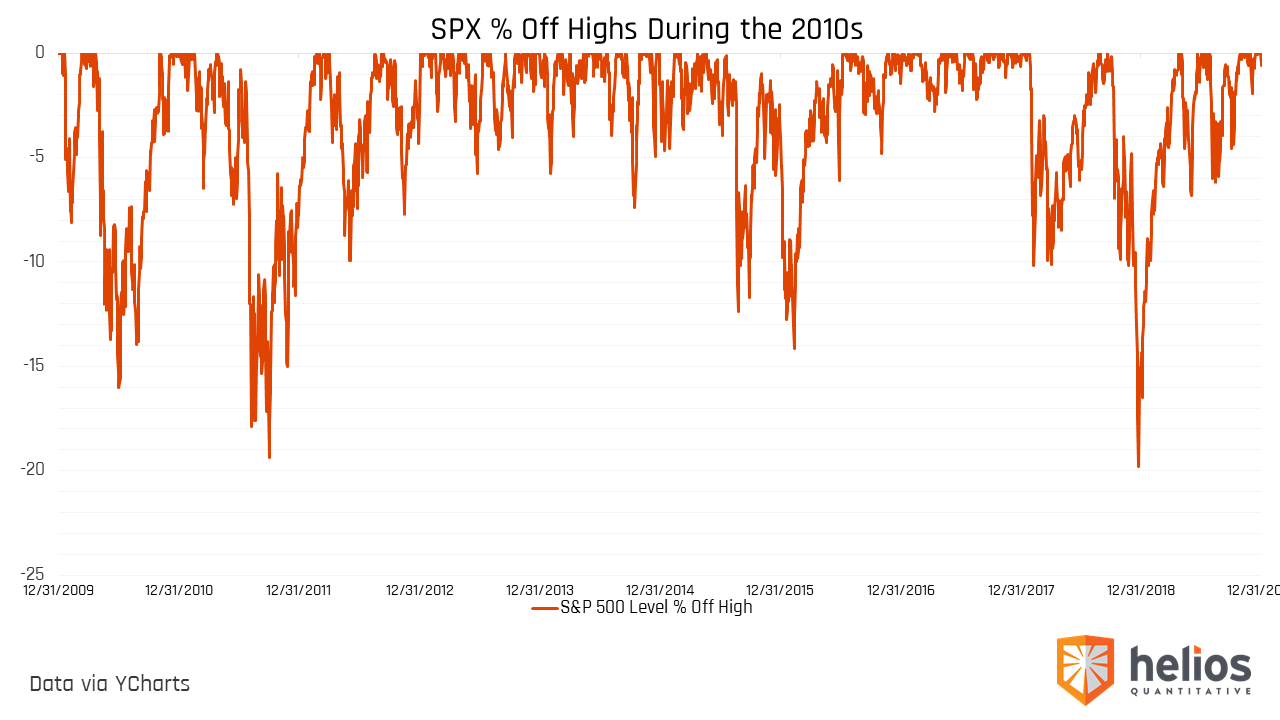 International economies never fully recovered from the great depression, with many double-dipping into contraction and propped up by monetary policy. Trade wars between the two largest economies in the world took place (and continue to take place). I could go on and on and add more things in like when the price of oil collapsed, the S&P downgraded U.S. debt or that one time our President was impeached, but you already know that stuff. What I am trying to convey is that there were a lot of really good reasons to believe that the market would not have returned what the chart below tells us it returned during the 2010s.
 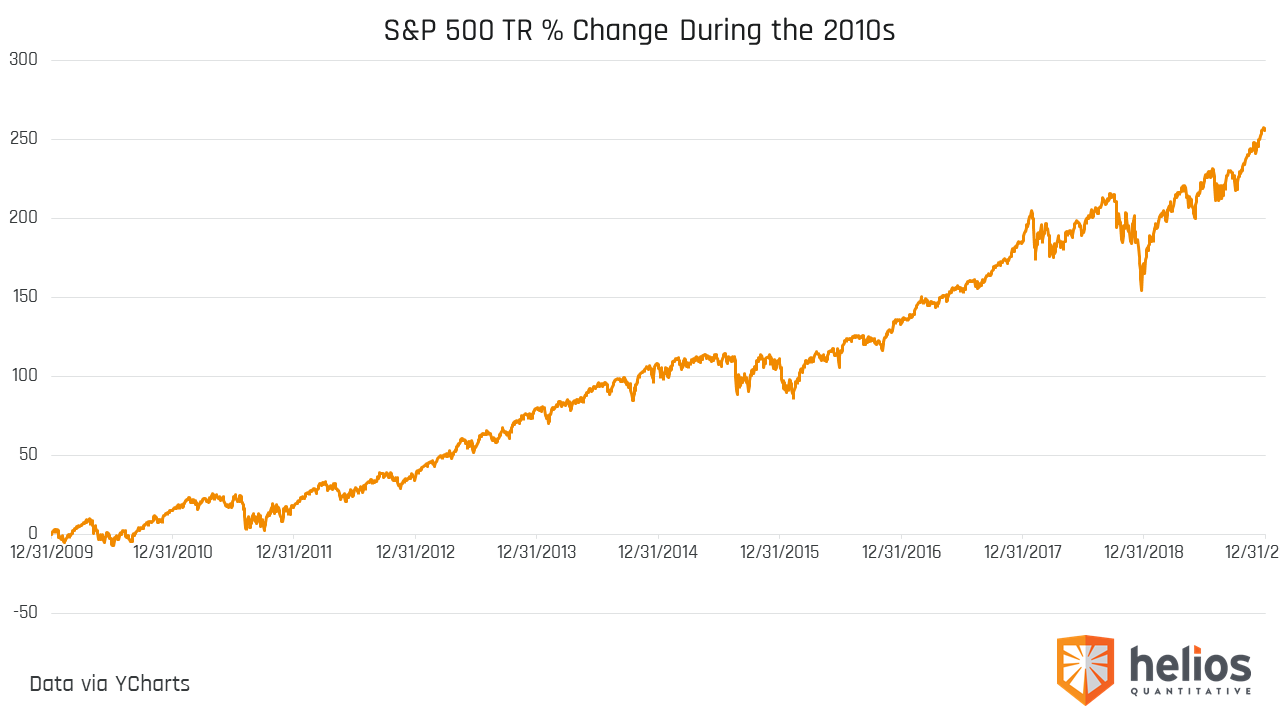 Oh yeah, other unpredicted events were things like expensive crushing cheap (growth vs. value).
 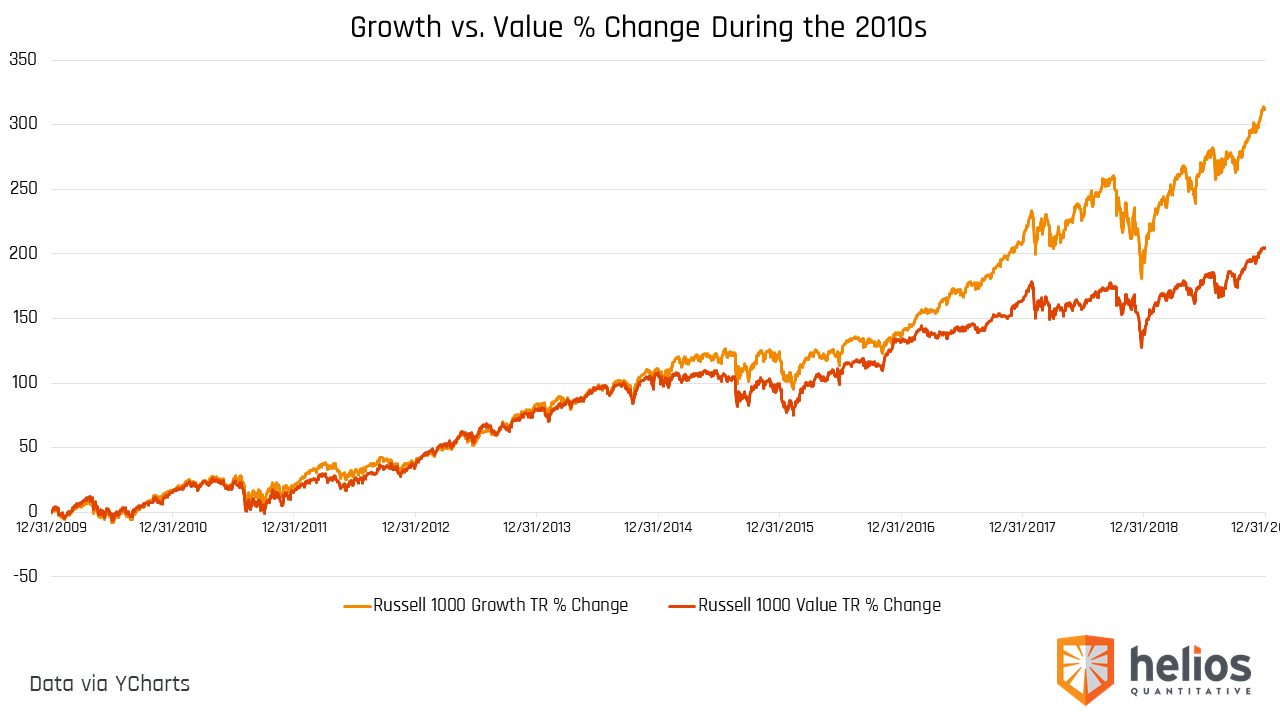 The big guys outperforming the small guys (large caps vs. small caps).
 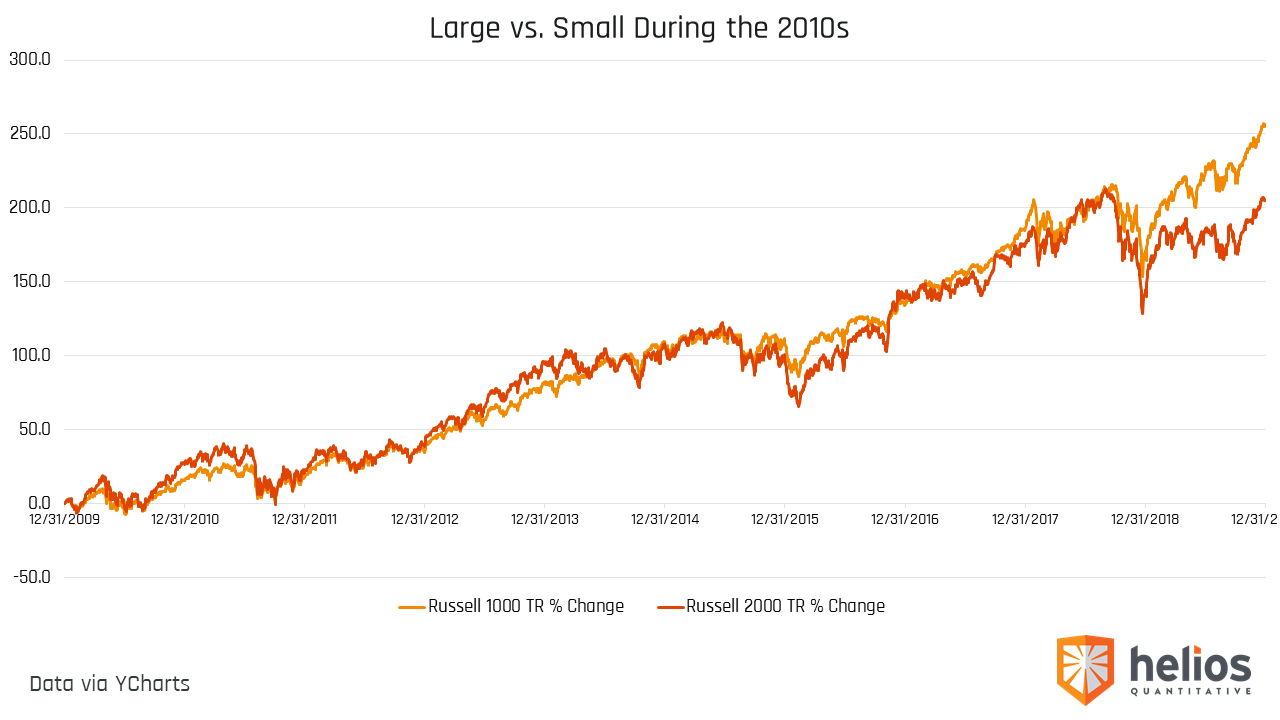 Domestic hammering international returns, etc.
 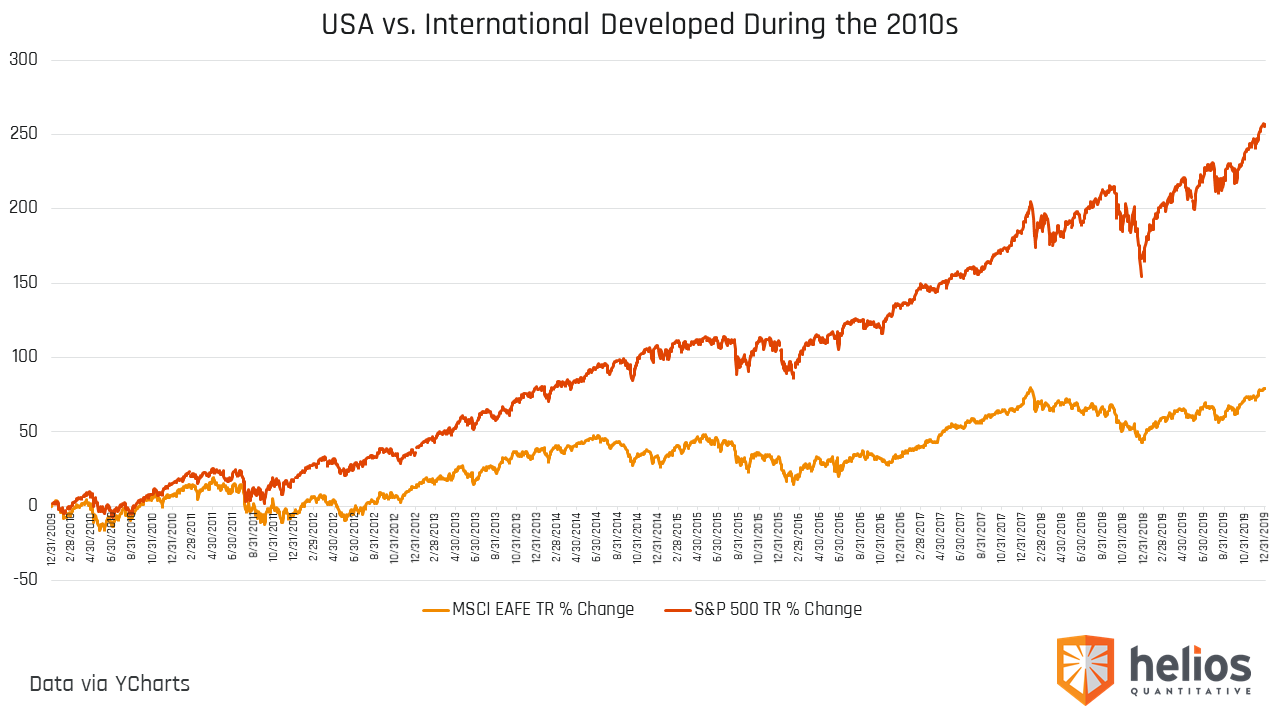 As well as these five stocks making everyone read stories of “if you bought X stock at its IPO, you’d be a X-illionaire.”
 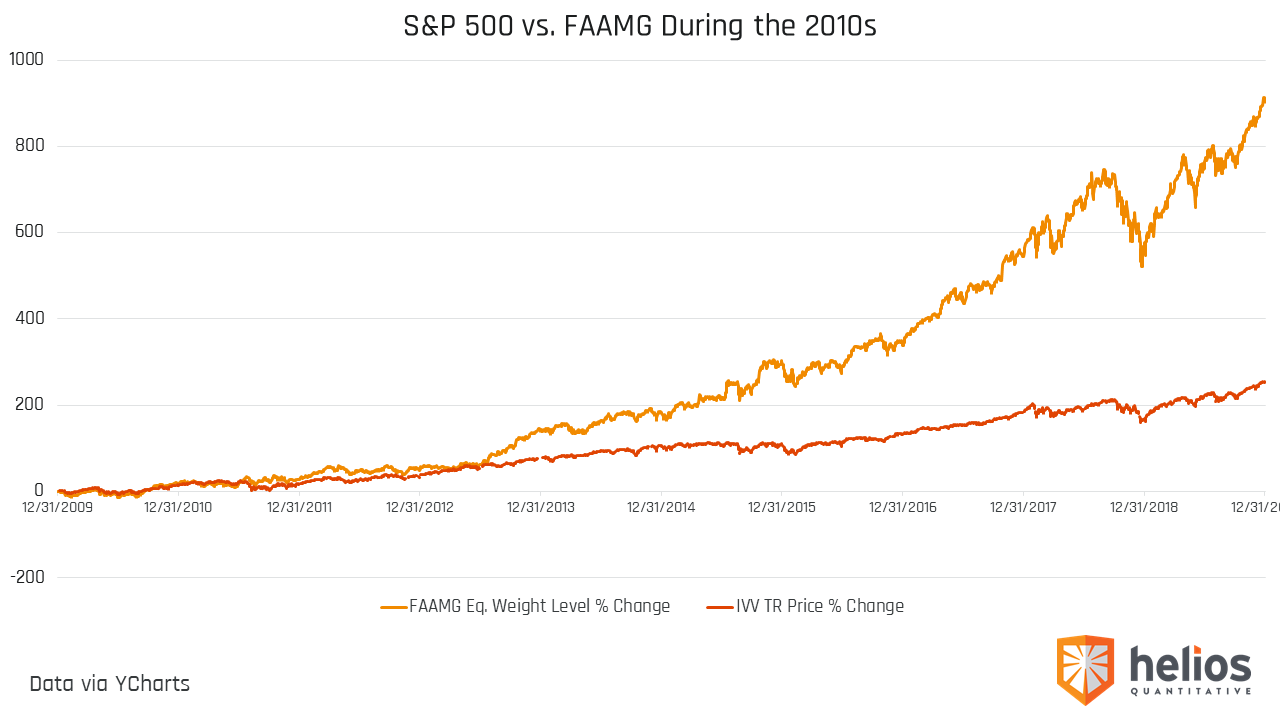 Even the fixed income markets pump-faked investors as rates hit the floor, global balance sheet risk grew and then diminished, and investors scrambled as “the end” of a 35-year declining interest rate cycle began, then ended, then began again (to be determined). Oh yeah, the 10-year US treasury yield dipped below the 2-year yield, sending shivers down the spine of anyone who remembered the last seven recessions. To make matters worse, trillions of dollars across the globe invested in negative-yielding debt.
 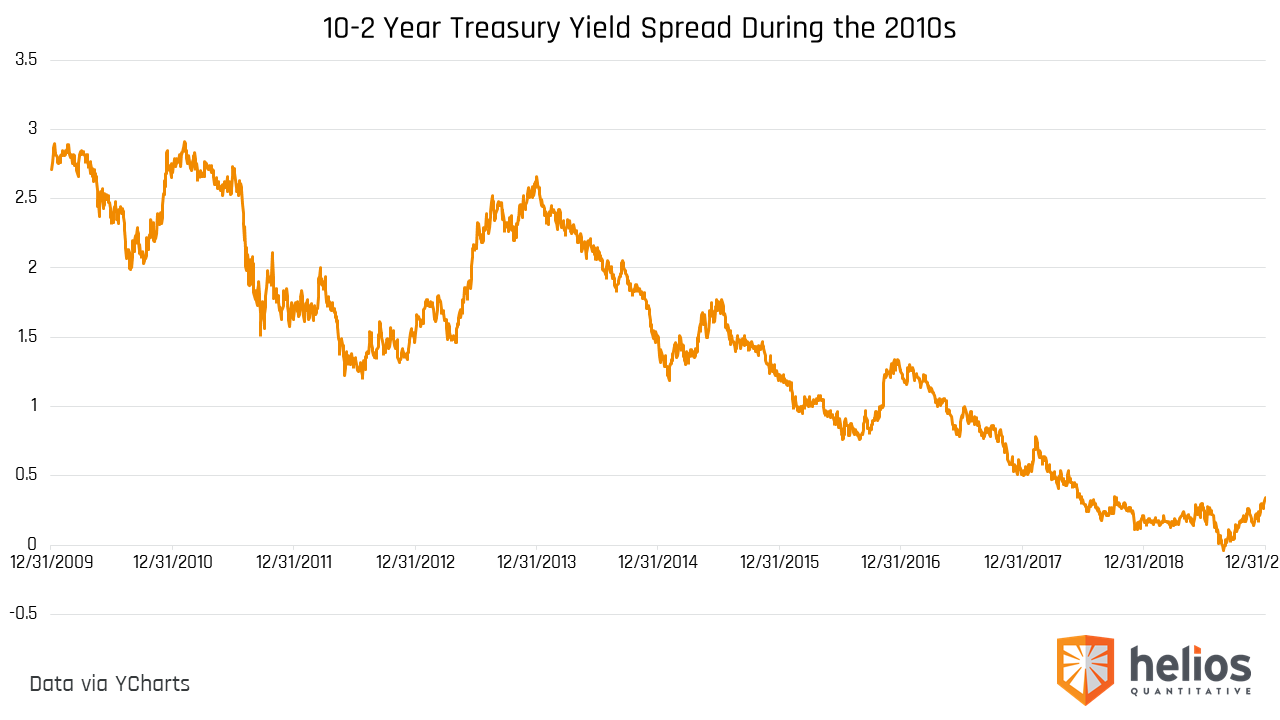 Military conflicts happened during the 2010s, but nothing as severe as the events or wars of the past. Looking back at the worst attack on U.S. shores since Pearl Harbor, the S&P 500 only took 18 trading days to recover. Therefore, as events between the U.S. and Iran have grabbed the world’s attention, we thought that it’s important to point out that focusing on data instead of isolated events have been a much better strategy over the past decade, and we don’t anticipate that changing in anytime soon. Here are a few of the many data points in addition to the traditional quantitative factors that we like to focus on instead of isolated events.
- Implied and realized volatility in equities and their trends in the context of historical averages.
- Global balance sheet risk as measured by data points such as credit spreads in the context of historical averages.
- Composite readings of leading and lagging economic indicators and how they are trending in the context of historical averages.
By utilizing algorithms which read the signals such as what I have described above, we can seek to achieve a greater compounding effect with our asset allocation strategies over the course of an economic cycle. However, we don’t stop there because we must seek to select the best ETFs and mutual funds that can track our strategies effectively. To achieve this goal, we refine the fund selection process for our advisors by using criteria such as alpha, excess return, up and down capture adjustment, risk variance, tracking error, and total cost. Although it sounds like I am talking our book at this point, I am not. I am trying to point out that in order to eliminate behavioral issues such as reacting to big headlines (which seem very important at the time), relying on algorithms to make allocation and fund selection decisions for us is a much less painful approach to investing. If there is one thing we’ve learned during the past decade, it’s that markets do not act like you think they will, and having a predetermined approach that filters noise from signals is the best way to invest for the next decade and beyond. – Nyle Bayer, follow me on Twitter @nylebayer Helios Quantitative Research is a dba of Clear Creek Financial Management, LLC, a Registered Investment Advisor. This commentary on this website reflects the personal opinions, viewpoints and analyses of the Clear Creek Financial Management, LLC employees providing such comments, and should not be regarded as a description of advisory services provided by Clear Creek Financial Management, LLC or performance returns of any Clear Creek Financial Management, LLC Investments client. The views reflected in the commentary are subject to change at any time without notice. Nothing on this website constitutes investment advice, performance data or any recommendation that any particular security, portfolio of securities, transaction or investment strategy is suitable for any specific person. Any mention of a particular security and related performance data is not a recommendation to buy or sell that security. Clear Creek Financial Management, LLC manages its clients’ accounts using a variety of investment techniques and strategies, which are not necessarily discussed in the commentary. Investments in securities involve the risk of loss. Past performance is no guarantee of future results.