There has been a lot of chatter in recent weeks about the potential for a looming recession, as the market sell-off and new lows for stocks incite panic. Market analysts have long pointed to a flattening yield curve as a telltale sign of a forthcoming recession. It’s true the yield curve is flattening right now, but does that mean a recession is imminent? Not quite. A look at the yield curve The two- and five-year Treasuries are inverted, and if the Federal Reserve raises rates in December, as is widely anticipated, we may see additional points of inversion. We know what historically happens to the economy when the yield curve inverts, and over the past 35 years, there have been three instances when the yield on a two-year Treasury note exceeded the yield on a 10-year Treasury note – late 1988, mid-1998 and late 2005. Each of these three occurrences preceded a U.S. recession within two years. The below graph shows the relationship between the steepness of the yield curve spread (gray line) and the occurrence of a recession (orange shaded). When the yield curve passes below zero, it’s called an inversion and means the two-year yield is greater than the 10-year yield. The red circles indicate inversions that preceded a recession and the green arrow shows when it came close, but didn’t invert. ![]() Data Source: Bloomberg A different scenario for the yield curve The green arrow on the above chart points to 1994, an important historical marker for investors who are concerned right now because a similar scenario played out then:
Data Source: Bloomberg A different scenario for the yield curve The green arrow on the above chart points to 1994, an important historical marker for investors who are concerned right now because a similar scenario played out then:
- Alan Greenspan was the Federal Reserve Chairman, and the Fed was being aggressive in its interest rate tightening. From the end of January 1994 to February 1995, the Fed raised the Federal Funds Target Rate 300 basis points from 3.0% to 6.0%.
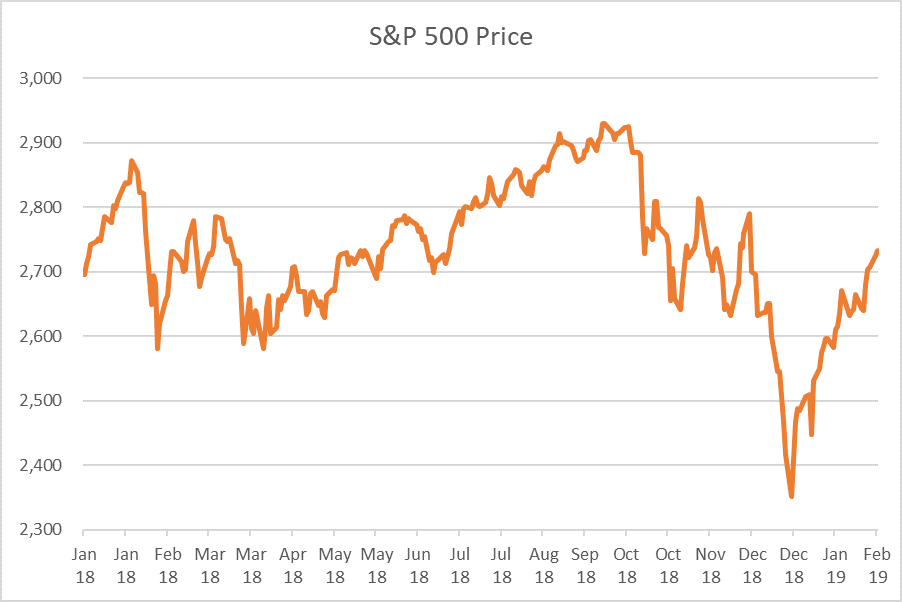
- 1994 was a tough year for equities and bonds. Asset class returns in 1994 were similar to what we are seeing in 2018.
- U.S. CPI, less Food & Energy, entered the period at 2.90% year-over-year.
- The U-3 U.S. Unemployment Rate was 6.60%.
Amid these economic conditions, the yield curve flattened; however, it did not invert. It came within 0.085% on December 27, 1994 and stayed relatively flat until May 1998. This initial flattening was followed by a strong equity market that lasted for several years. The 1994 market conditions mirror our current landscape. The below table compares conditions in 1994-1995 to conditions from 2016 through the present. 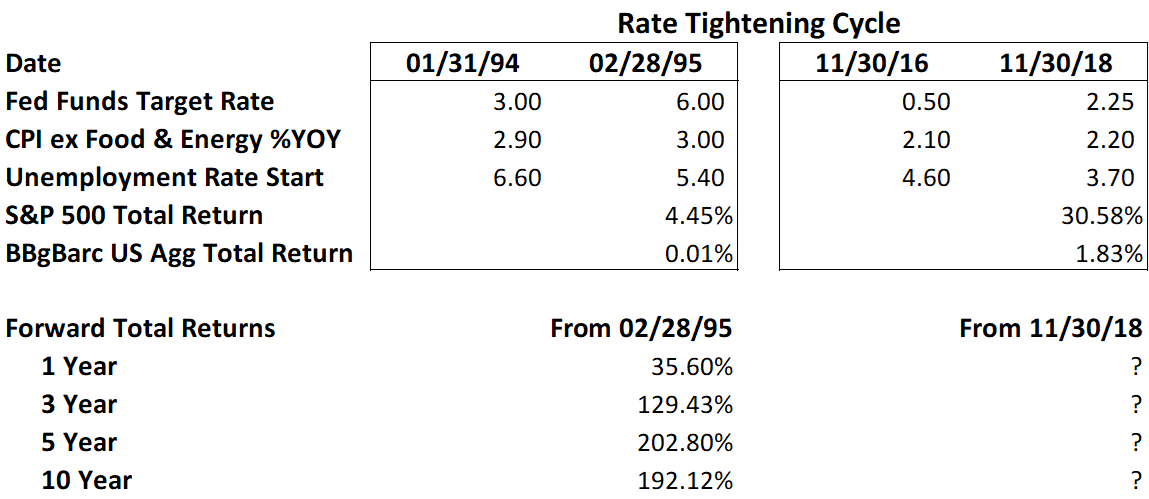 Data Source: Bloomberg The most important thing investors need to recognize is that the economy is still healthy. The Federal Reserve is under a dual mandate: Reaching full employment and keeping inflation in check. Right now, unemployment is incredibly low, holding at 3.7% in December, and inflation isn’t a significant concern. The Fed is getting rates back to normal, an expected exercise in a healthy economy. If the Fed determines we are near neutral rates and pauses its tightening in 2019, could 2019 and beyond look like the years after 1994? The bottom line: While analysts might believe a very flat to inverted yield curve will cause a recession, there aren’t a significant number of instances in recent history. From Helios’ perspective and when considering the conditions from 1994, the data isn’t statistically significant.